

- Seconds
From a brief to a finished visual
- 60+
AI models in one workspace
- Any style
Editorial, minimal, hand-drawn, isometric
- Up to 4K
Export resolution for decks and campaigns
From rough idea to finished infographic
Four steps, no design software and no template lock-in.
- 01
Drop in your content
Paste a stat, an outline, a transcript, or a rough sketch. Add a brand reference if you have one.
- 02
Choose a format
Pick a process flow, comparison, timeline, list, data-viz, or stat strip, and call out the look you want.
- 03
Generate options
Get multiple polished concepts at once and compare them side by side across models.
- 04
Refine and export
Tweak the prompt, swap the palette, regenerate the parts you want, and export in high resolution.
Use the best AI model for every infographic
No other tool lets you compare them. Each one is strong at a different part of the job — legible typography, clean charts, on-brand illustration — and Masonry gives you all of them.
Ideogram
Ideogram V3 Quality
The pick for infographics. Renders crisp, accurate in-image typography, labels, axis text, and callouts the others tend to fudge.
Recraft
Recraft V3
Clean, vector-feeling design output with strong brand-style control. The pick for a polished, on-brand editorial look.
Nano Banana Pro
Best all-rounder when the infographic mixes data, scenes, and photo content. Strong prompt adherence and faithful composition.
ByteDance
Seedream 4.5
Fast, high-detail renders for exploring lots of layout directions before locking in a finalist.
Black Forest Labs
FLUX.2 Pro
Sharp, controllable output, the pick when you want a consistent house style locked across a whole campaign of visuals.
OpenAI
GPT Image 2
Reliable edits and restyles. Use it to keep most of a generated infographic and change only a section, palette, or piece of copy.
Everything you need to ship a finished infographic
Generate, restyle, and refine on-brand visuals without juggling tools or losing the layout you started with.
Editorial, not template-y
Generate visuals that read like a designed magazine spread, not the same six Canva templates every other team is shipping.
Any style on demand
Flat, isometric, hand-drawn, neon, editorial, minimal, dark mode. Restyle the same content across looks in a single click.
Every top model in one place
Run the same brief through Ideogram, Recraft, Nano Banana Pro, FLUX, and Seedream, then keep the best result.
Instant variations
Spin up a dozen directions in the time a single Figma frame used to take, and iterate live with the team or client.
Built for on-brand output
Anchor on a reference image, lock a palette, and keep the same look across a whole series of campaign visuals.
Commercial-ready output
Export high-resolution visuals you can put in client decks, paid campaigns, landing pages, and printed handouts.
Every infographic type, on demand
Name any format, or anchor on a reference. The ones marketing teams generate most:
- Process flowStep-by-step visuals showing how something happens, ships, or works.
- ComparisonSide-by-side breakdowns: A vs B, before vs after, plan vs plan.
- TimelineChronological visuals for roadmaps, history, and milestone stories.
- StatisticalBig-number stat strips that lead with the headline figure.
- ListNumbered or checklist visuals that tighten a long post into one image.
- Data vizChart-led visuals: bars, donuts, lines, small multiples, mixed sets.
- HierarchicalOrg charts, decision trees, and pyramid visuals for structured ideas.
- GeographicMap-led visuals showing market, audience, or coverage.
- Anatomy / breakdownLabelled diagrams of a product, page, or concept with callouts.
- EditorialLong-form, magazine-style spreads with rich type and supporting graphics.
- MinimalSingle big idea, lots of negative space, a calm, restrained palette.
- Isometric3D-feeling axonometric illustrations for product and process visuals.
- Hand-drawnSketched, marker-style visuals with a human, off-template feel.
- Flat illustrationCrisp vector-feeling scenes with bold color blocks and clean shapes.
- Dark modeDeep backgrounds with luminous accents for social, dashboards, and decks.
Built for real marketing work
The same workspace covers the jobs that actually ship, from a launch announcement to a board deck.
Marketing and sales decks
Turn slide-bullet points into polished visuals that earn time on screen and survive the screenshot tour.
Social posts and carousels
Generate scroll-stopping stat cards, LinkedIn carousels, and Instagram explainers in seconds, on brand.
Blog and content visuals
Drop a unique infographic into every long-form post and lift dwell time, shares, and backlinks.
Reports and whitepapers
Translate research and survey data into editorial-quality figures without booking a design contractor.
Sales enablement
Spin up product comparison sheets, one-pagers, and pitch visuals tuned to each segment in minutes.
Internal comms and HR
Process flows, org charts, and onboarding visuals that actually get read instead of skimmed.
Your visuals, yours to use
Every infographic you generate is high-resolution and licensed for commercial use, so you can drop it into client decks, paid campaigns, landing pages, blog posts, and printed handouts. No watermarks, no per-image fees, no waiting on a contractor. Treat AI visuals as creative output, and review each model's terms for regulated topics, named entities, or trademarked content.
AI infographics vs hiring a designer or a template app
Not a replacement for a great designer, but a much faster way to ship the dozens of visuals marketing actually needs in a quarter.
- Minutes
From a brief to a finished visual, not days of back-and-forth
- $20/month to start
Versus $200+ per infographic from a freelancer
- Unlimited
Variations, not a fixed package or seat fee
- Original
An original visual every time, not the same Canva grid
Real infographics made with Masonry
A sample of infographics generated by the Masonry community across formats and styles.
AI infographic questions
What marketing teams ask before they switch.
Can AI actually generate a polished infographic?
Yes. Drop in a stat, an outline, a transcript, or a brand reference and Masonry generates editorial-quality infographics in seconds. The right model picks (especially Ideogram and Recraft) render in-image typography, axis labels, and callouts legibly, so the result reads as a designed piece rather than an obviously-AI mockup.
What kinds of infographics can it generate?
Process flows, comparisons, timelines, statistical (big-number) strips, lists and checklists, data-viz charts, hierarchical diagrams, anatomy breakdowns, geographic visuals, and editorial spreads. You can mix styles, anchor on a reference image, and call out specific palettes, layouts, or chart types.
Which AI model is best for infographics?
There is no single best model, and that is the point. Different models win at different briefs, so Masonry gives you all of them in one workspace and lets you compare results side by side. For an infographic, Nano Banana Pro is the best all-rounder for photoreal results with faithful layout, Seedream is fast and detailed for exploring options, FLUX gives the most control for a consistent style, and GPT Image is great for precise edits. You pick the winner for each shot instead of being locked into one engine.
Will it render text in the image legibly?
Yes, when you use the right model. Ideogram V3 Quality is the strongest at in-image typography, labels, axis text, and short callouts, and Recraft V3 holds up well for cleaner editorial output. Masonry lets you run the same brief through both, plus the photoreal generalists, so you can pick the one that nails your text first time.
Is it free, and how much does it cost?
You can start generating infographics for free, then upgrade when you need more generations or higher-resolution exports. It costs a fraction of what a freelance designer charges per visual and removes the seat fee of a template-based app.
Can I keep my brand colors, fonts, and look?
Yes. Anchor on a brand reference image, call out the palette and typography you want, and re-run the brief across variations. For a long campaign, lock a consistent house style with one of the more controllable models (FLUX or Recraft) and reuse it across every visual.
Can I edit a generated infographic?
Yes. Regenerate variations, swap the palette, change one section while keeping the rest, or hand the output to a designer to finish in Figma or Illustrator. You stay in control until the visual is right.
Can I use the infographics commercially?
Yes. Generated infographics are high-resolution and licensed for commercial use, so you can drop them into client decks, paid campaigns, landing pages, blog posts, and printed handouts. Review each model's terms for regulated topics, named entities, or trademarked content, and treat AI visuals as creative output you check before shipping.
Is this an alternative to Canva, Piktochart, or Venngage?
Yes, with a different shape. Template apps give you a grid of fixed layouts to fill in. Masonry generates an original visual for your specific brief, in any style, using the strongest current AI image models. Use it when you want output that does not look like every other team is shipping it.
What should I drop in for the best result?
A clear, specific brief. The format you want (process flow, comparison, timeline, stat strip), the actual content (the steps, the stats, the labels), the style or reference image, and any must-keep brand details. Specific briefs produce specific visuals.
How long does an infographic take to generate?
Seconds. Most concepts generate in well under a minute, so you can explore a dozen directions in the time a single Figma frame used to take.
Ship your next infographic today
Turn any brief, stat, or outline into a polished visual in seconds. No design software, no template lock-in.
Explore more AI design tools

AI Interior Design
Restyle any room into photorealistic concepts in any style, in seconds.

AI Landscape Design
Redesign any yard into photorealistic outdoor concepts, in seconds.
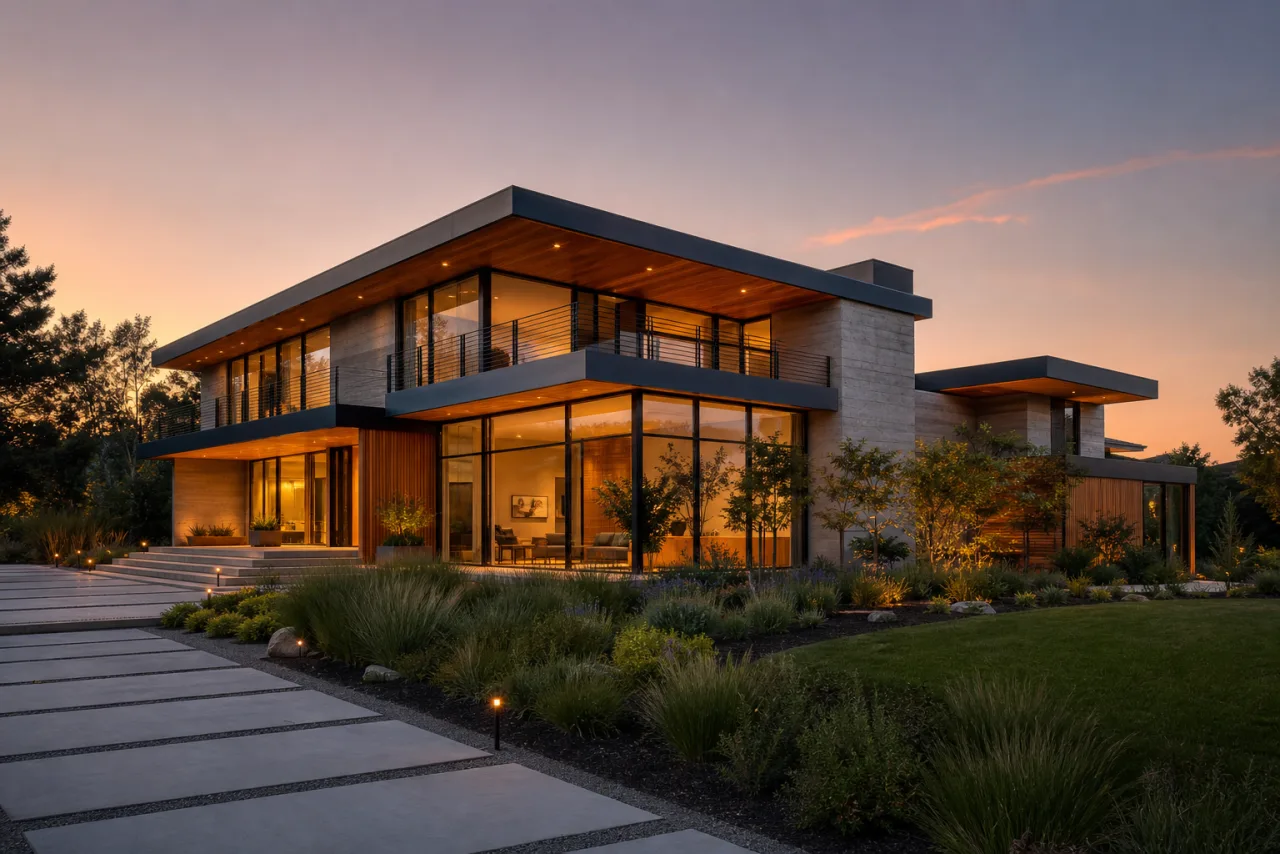
AI Home Exterior Design
Test siding, paint, and architectural styles on your real facade.

AI Product Photography
Turn a plain product photo into studio and lifestyle shots in seconds.